Quick Start - At the Face
This topic is part of the Studio
Mapper Quick Start Guide.
Tasks to Complete At the Face
This collection of tasks are commonly undertaken at the face. Time is often limited here, but Studio Mapper is a very efficient digital field book and lets you capture face details quickly and accurately. The steps listed below represent a minimum case; it's possible that more can be done in situ if time allows, but for the purposes of this guide, it is assumed that time restrictions only permit essential tasks and that further map preparation will be completed back at the office (the next section of this Guide).
The information below applies to both face and level mapping.
Tip: If you are using a portable device, automatically display a screen keyboard for easier data entry at the face. Enable screen keyboard mode using the Setup ribbon's On-Screen Keyboard command.
The following example tasks are covered in this section:
-
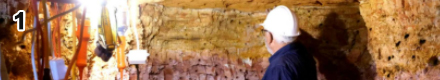
If face mapping, Capture and store an image of the face. Images can also be captured during level mapping, but it is assumed this isn't a typical workflow.
-
Capture contacts and features by digitizing them. Level mapping will probably include capture of measurements from survey stations to evidence of structure intersects.
-
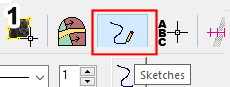
Add sketches to your map to indicate throw or other useful information.
-
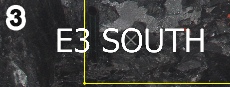
Add comments to your map to indicate the general face location, a tape line measurement or other useful annotations relating to the selected area.
Many other tasks are available, including capturing channel sample and stratigraphic section information, although these apply mainly to face mapping. Vertical section mapping, for example, isn't relevant when mapping backs, for example.
| Capture Contacts and Features | |||
|
|
|
|
|
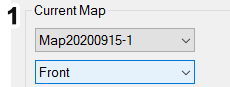
If you choose to capture contacts and features at the face, use the Mapping task bar to select the base map and face for your location. Select the Features tab.
|
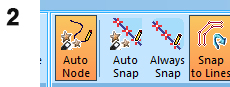
Check and adjust your Snap and Auto Node settings using the Draw (Features) ribbon. Enable Auto Node and disable Auto Snap and Always Snap |
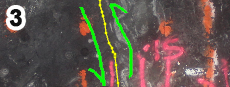
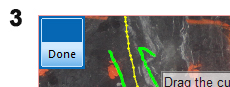
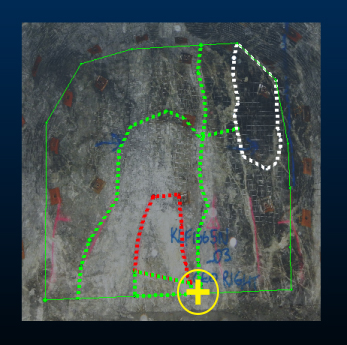
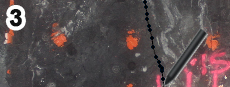
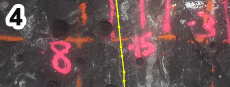
On the Features panel, select to add a contact feature that captures the vertical exposed contact that transects the channel markings below. Digitize by pressing the stylus/finger to the screen (or holding down the left mouse button) and dragging to create a line downward. Click Done when you're finished. |
A new entry appears in the Features grid below (or more if you digitized more structures). Define any custom attributes for your contact, for example:
Save your project. |
|
Whilst face mapping, when you select a Map, the first available face is automatically selected. Level mapping involves a single 'face' to represent the level, although associated drive maps may be available. You can georeference a face map before adding features if reference data is available as it will help you define the geology. If so, you can ignore this set of tasks. Similarly, you could also digitize features back at the office if your captured image is clear enough. This guide assumes you want to digitize at the face or back features. |
Auto Node, if enabled is useful for freeform digitizing of features. If disabled, point-to-point digitizing is performed. It depends on the nature of the geology. More... Auto Snap will automatically snap to data if it is close to your stylus/cursor/finger on screen. More... Always Snap will force data snapping at all times. More...
|
Selecting any option activates live digitizing mode. You'll see a Done button appear in the top left corner of the map window as soon as digitizing mode is active. It isn't important what you digitize for the purpose of this guide. Feel free to experiment with the Polygon and Point feature if you like, clicking Done after each structure is drawn. You are digitizing into the Geology data object. Other data objects are available, as set up in your system configuration file. |
The attributes you can set for each object are defined in your system configuration file, and can be different for each object if you wish, including attributes and visual formatting. If you're not sure sure which feature belongs to which table entry, you can either select the feature data to highlight both it and the table row, or click a table row to highlight the map data in the map window. Easy! |